
.svg)


.svg)

Topic
Text
This article explores how earth observation and geospatial data enable data-driven green mobility strategies. By analyzing the environmental impact of transport systems, it shows how satellite insights support mobility planning through monitoring land use, heat stress, air quality, and climate risks. The article highlights how geospatial intelligence improves infrastructure resilience, optimizes soft mobility flows, and supports sustainable urban decision-making, concluding with Latitudo40’s ongoing Green Urban Navigator experiment.
Article
Content
The climate impact of mobility systems
.jpg)
Mobility systems are a major driver of climate change and environmental degradation. According to European and international assessments, the transport sector accounts for around 24–25% of global energy-related CO₂ emissions, with road transport contributing over 70% of this total. In the European Union alone, transport is responsible for approximately 25% of total greenhouse gas emissions, making it the largest emitting sector, ahead of energy production and industry. Unlike other sectors, transport emissions in Europe are still around 20% higher than in 1990, highlighting the structural difficulty of decarbonizing mobility.
The climate impact of mobility is closely linked to air quality. Road transport contributes up to 40% of nitrogen dioxide (NO₂) concentrations in urban areas and is a major source of particulate matter (PM10 and PM2.5), which is associated with over 300,000 premature deaths per year in Europe. These impacts are particularly acute in cities, where traffic density intersects with population exposure.
Mobility also exerts strong pressure on land systems. Transport infrastructure is a leading cause of soil sealing and landscape fragmentation, accounting for a significant share of land take in Europe—estimated at over 1,000 km² per year in recent decades. This spatial footprint reduces ecosystem connectivity and increases climate vulnerability, including flood risk and urban heat stress.
The economic consequences are equally substantial. Environmental and health externalities linked to transport—air pollution, climate damage, noise, and congestion—generate annual costs exceeding €800 billion in Europe. These figures underscore the urgency of rethinking mobility through green mobility strategies, supported by earth observation and geospatial data to enable data-driven mobility planning and measurable impact reduction.
The sustainable mobility paradigm: definition, goals and current adoption
Sustainable mobility represents a systemic approach to designing and managing transport systems in a way that minimizes environmental impact while preserving accessibility, safety, and economic efficiency. Within this paradigm, green mobility aims to decouple mobility demand from greenhouse gas emissions, air pollution, and land consumption by promoting low-emission transport modes, energy efficiency, and integrated urban planning.
The core objectives of sustainable mobility include the reduction of CO₂ and air pollutant emissions, lower dependence on fossil fuels, improved public health, and increased resilience of transport systems to climate stressors. Key levers involve shifting modal share toward public transport, active mobility, and shared solutions, alongside the electrification of vehicle fleets and the optimization of transport networks. Importantly, sustainable mobility extends beyond vehicle technology, addressing the spatial organization of cities and the interaction between transport infrastructure, land use, and environmental conditions.
Adoption of sustainable mobility strategies is accelerating but remains uneven. In Europe, more than 70% of cities with over 100,000 inhabitants have developed or are implementing Sustainable Urban Mobility Plans (SUMPs), driven by EU policy frameworks and climate targets. However, the real-world effectiveness of these initiatives varies significantly due to differences in data availability, monitoring capabilities, and governance capacity. Globally, urban areas still account for over 60% of transport-related emissions, indicating a persistent gap between policy ambition and measurable outcomes.
Closing this gap requires moving from principle-based strategies to evidence-based mobility planning. Integrating geospatial data and earth observation enables continuous monitoring, impact assessment, and scenario analysis, providing the analytical backbone needed to operationalize sustainable mobility at scale.
How Earth Observation data support green mobility
Earth observation provides a critical data layer to operationalize green mobility strategies by delivering consistent, spatially explicit information on how transport systems interact with the environment. Satellite-derived geospatial data enable the monitoring of land use, air quality, thermal patterns, and climate-related risks at multiple scales, overcoming the limitations of ground-based measurements. Integrated into analytical models, Earth Observation enhances mobility planning by supporting scenario evaluation, infrastructure optimization, and impact assessment over time. This data-driven approach allows public authorities and mobility operators to quantify environmental trade-offs, prioritize interventions, and measure the effectiveness of sustainable mobility policies with objective, repeatable indicators.
Monitoring environmental variables with satellite data
Satellite-based earth observation enables continuous and scalable monitoring of environmental variables directly influenced by mobility systems. High-resolution geospatial data capture spatial and temporal dynamics that are critical for mobility planning, including land transformation, atmospheric conditions, and urban microclimates. By integrating these datasets into analytical workflows, decision-makers can quantify the environmental footprint of transport infrastructure, assess policy impacts, and support green mobility strategies with objective, comparable indicators across cities and regions.
Land use monitoring and soil fragmentation analysis
Satellite-derived land use / land cover (LULC) products like Latitudo40’s Premium Land Cover Map layer provide a spatially explicit classification of surface cover, distinguishing artificial surfaces, vegetation types, water bodies, and other classes critical to assessing how mobility infrastructure shapes the landscape. By mapping these classes at high resolution, analysts can quantify land take—the conversion of natural, agricultural, or semi-natural areas into infrastructure—and monitor trends over time.
.webp)
Across Europe, transport infrastructure (roads, railways, airports) contributes significantly to land take. Historic data show that transport networks occupy a measurable share of terrestrial land, and settlement areas have expanded by about 13% in the EU-27 between 2005 and 2023, with transport and built-up areas driving much of this change. Fragmentation metrics indicate an increase in isolated habitat patches and reduced contiguous natural land, undermining ecosystem connectivity and resilience. At the same time, estimates suggest that more than 1,000 km² of land per year are consumed for urban expansion and infrastructure, with profound impacts on soil carbon storage, biodiversity, and ecosystem services.
Integrating the Premium Land Cover Map layer into mobility planning workflows enables planners to visualize where transport networks intersect with high-value land cover classes, assess fragmentation intensity, and evaluate alternative routing or densification scenarios that minimize land take. Coupled with earth observation time series, these geospatial data support evidence-based decisions that align green mobility objectives with broader environmental stewardship.
Thermal patterns and urban heat island detection
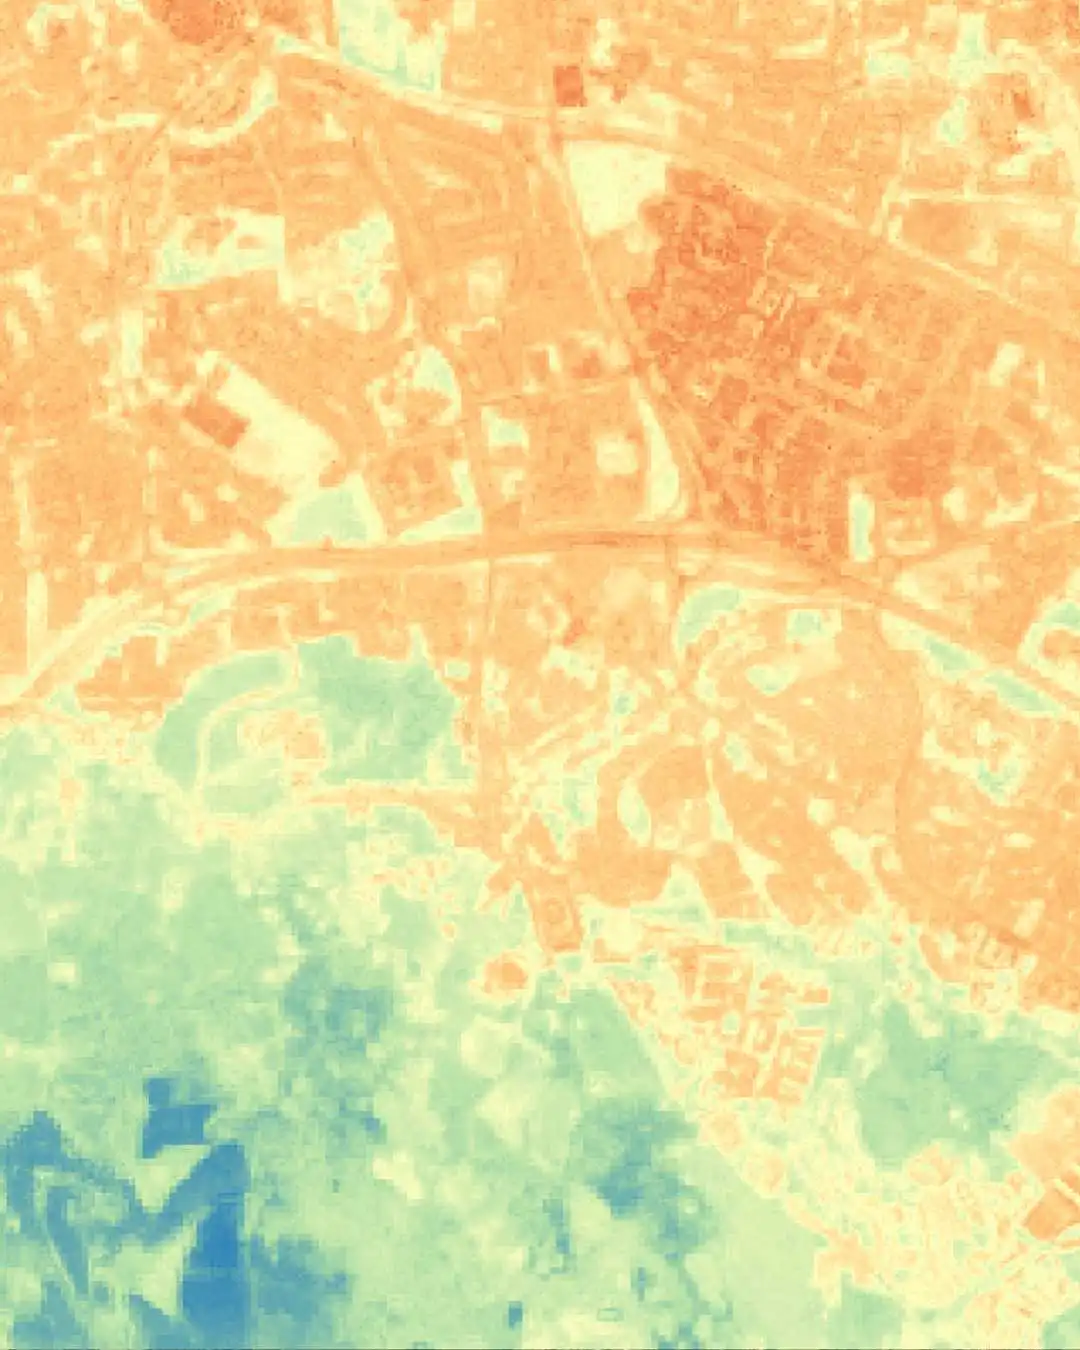
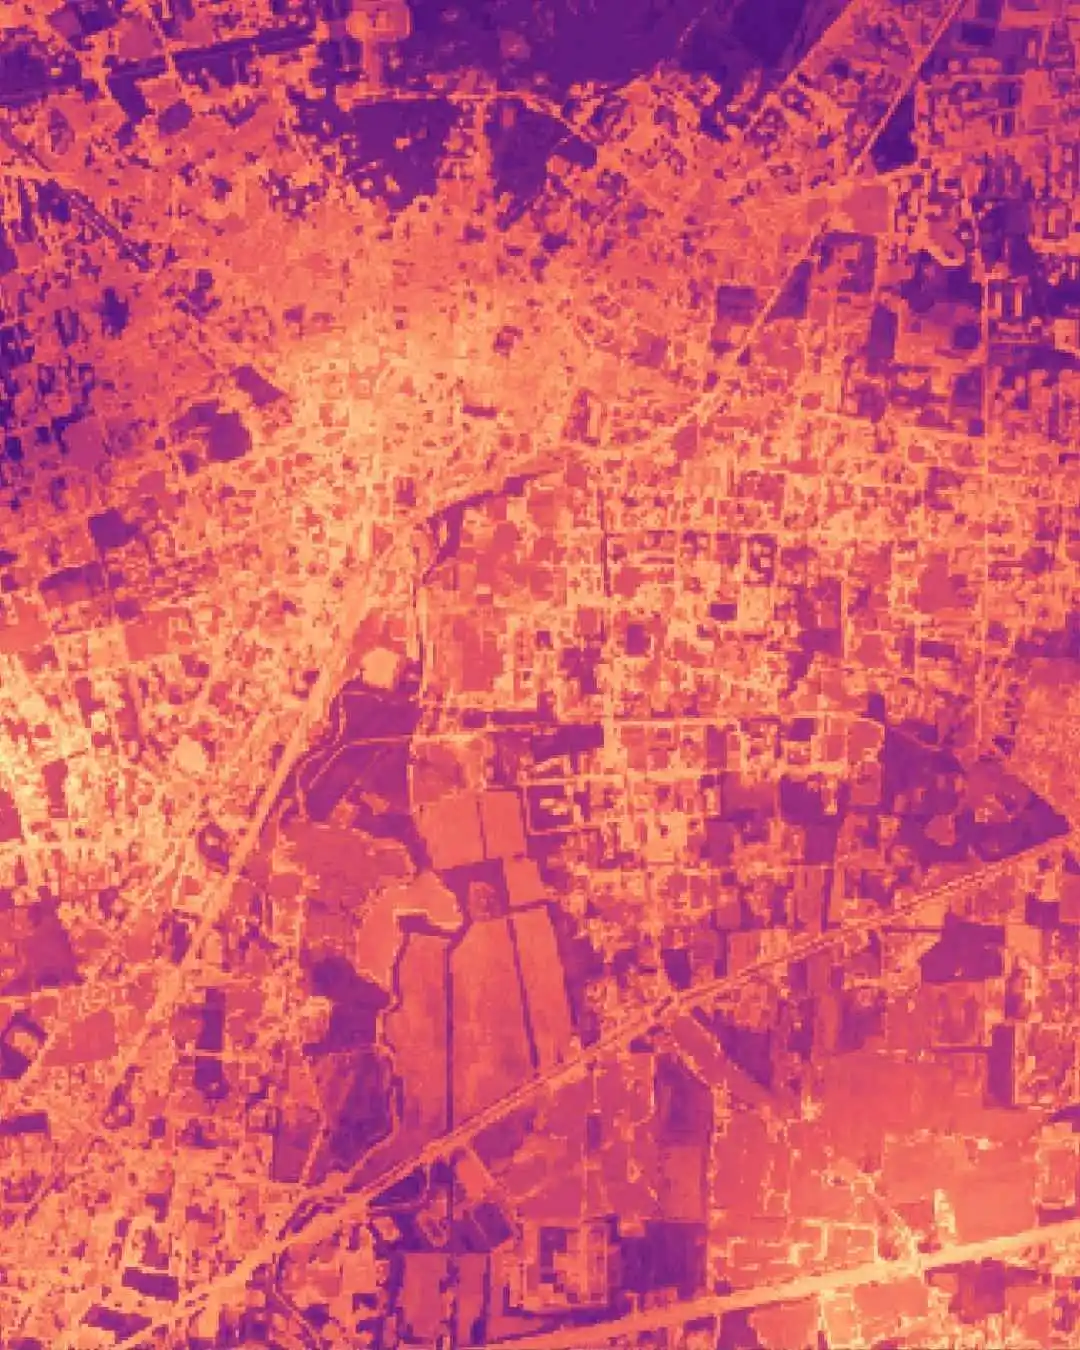
Satellite-derived thermal products such as Latitudo 40’s Land Surface Temperature Layers, Surface Urban Heat Island Layer and Heatwave Potential Risk Map quantify surface and urban heat signatures over large areas with consistent temporal frequency. Land Surface Temperature (LST) maps thermal emission from the ground, revealing hotspots where built-up surfaces absorb and retain heat more than vegetated or rural surroundings. These data show that urban areas regularly experience elevated surface temperatures—often several degrees above peri-urban zones—due to the urban heat island (UHI) effect, which exacerbates heat stress, energy demand, and heat-related health risks. Satellite time series make it possible to track how LST evolves diurnally and seasonally, informing planners where heat mitigation is most needed.
The Surface Urban Heat Island layer isolates the differential thermal signature between urban and rural land covers, providing a spatially explicit indicator of heat island intensity. High SUHI values correlate strongly with high imperviousness and traffic-dense corridors, making them relevant proxies for evaluating the environmental footprint of transport infrastructure. Combining SUHI with Land Surface Temperature estimations up to 4 times a day enables analysts to detect temporal persistence of heat anomalies linked to daily mobility patterns, such as rush-hour congestion or inefficient traffic flows. Finally, Heatwave Potential Risk Map highlights localized heat risk zones, aiding in mobility planning by identifying where thermal discomfort may deter walking or cycling, and where interventions such as green corridors or shade infrastructure could enhance green mobility outcomes. Integrating these geospatial data into planning frameworks allows objective assessment of thermal phenomena and supports targeted strategies to reduce heat exposure in urban transport networks.
Air quality monitoring and CO₂ concentration assessment
Air quality is one of the most direct interfaces between mobility systems and public health. Road transport is a dominant source of urban NO₂ and a significant contributor to particulate matter and CO₂ emissions, especially along high-traffic corridors. Earth observation complements ground-based monitoring networks by providing spatially continuous measurements of atmospheric pollutants, overcoming the limitations of sparse sensor coverage and enabling consistent comparisons across regions.
Satellite missions such as those supporting the Copernicus programme deliver geospatial data on tropospheric NO₂ and CO₂ concentrations with high temporal frequency. These datasets allow analysts to identify emission hotspots, correlate pollutant levels with traffic intensity, and assess temporal variations linked to mobility patterns, policy interventions, or seasonal effects. During recent years, satellite observations have clearly shown how reductions in traffic volumes lead to measurable short-term decreases in NO₂ concentrations over metropolitan areas, validating the strong coupling between mobility demand and air quality.
For mobility planning, this information is critical. Integrating satellite-based air quality indicators into transport models enables ex-ante and ex-post evaluation of measures such as low-emission zones, modal shifts, or traffic rerouting. From a green mobility perspective, Earth Observation provides objective evidence to prioritize interventions where environmental and health benefits are highest, supporting data-driven decisions that align transport efficiency with long-term climate and air quality objectives.
Preventing environmental risks to mobility infrastructure
Climate change is increasing the frequency and intensity of environmental hazards that directly threaten mobility infrastructure, including roads, railways, cycling networks, and intermodal hubs. Flooding, landslides, extreme heat, seismic activity, and vegetation-related hazards can disrupt transport services, damage assets, and generate cascading impacts on safety and accessibility. Earth observation provides a scalable and objective framework to anticipate these risks and integrate resilience into mobility planning.
.jpg)
Satellite-derived flooding risk layers combine topography, land cover, hydrology, and historical event data to identify areas where transport infrastructure is exposed to surface water accumulation or river overflow. These insights support proactive planning, enabling authorities to prioritize reinforcement, drainage upgrades, or alternative routing in high-risk zones. Similarly, building height data derived from remote sensing help assess exposure and vulnerability in dense urban environments, supporting emergency planning and infrastructure redundancy analysis in the event of extreme events.
Vegetation represents another often underestimated risk factor. High-resolution tree height layers allow the identification of road and rail segments exposed to falling trees or branches during storms, particularly in peri-urban and forested areas. Integrating these datasets into maintenance planning reduces service disruptions and improves safety outcomes.
Looking ahead, the integration of seismic risk layers will further strengthen risk-aware mobility strategies, enabling infrastructure managers to evaluate structural exposure in earthquake-prone regions and align investment priorities accordingly. By combining these heterogeneous datasets into a unified geospatial framework, geospatial data transform environmental risk from an external uncertainty into a quantifiable planning variable. This approach is essential to ensure that green mobility systems are not only low-emission, but also resilient, reliable, and adaptive to a changing climate.
Redirecting traffic flows through geospatial intelligence
Geospatial intelligence enables mobility systems to move from static routing to adaptive, environment-aware traffic management. By integrating earth observation data into analytical models, planners can evaluate how environmental conditions influence the usability and safety of mobility corridors, particularly for pedestrians, cyclists, and other forms of soft mobility.
Satellite-derived layers provide spatial indicators that go beyond conventional traffic metrics. These datasets allow the identification of routes that are more resilient to extreme weather, less exposed to heat stress, and better aligned with environmental comfort thresholds. For example, pedestrian flows can be redirected away from areas with recurrent surface water accumulation or high thermal load, and toward corridors with greater shading, ventilation, and lower environmental risk.
This multi-criteria approach supports mobility planning that prioritizes accessibility and well-being alongside efficiency. By embedding geospatial data into routing and decision-support systems, cities can dynamically adapt mobility networks to changing environmental conditions, improving reliability and user experience. In the context of green mobility, redirecting traffic flows based on satellite-driven insights helps encourage active transport, reduce exposure to environmental stressors, and align daily mobility choices with broader sustainability and climate resilience objectives.

Green Urban Navigator: a Latitudo 40 experiment for green mobility
Green Urban Navigator is an ongoing Latitudo 40 R&D project that explores how earth observation, geospatial data, and AI can reshape everyday mobility decisions. Currently under development, the initiative aims to translate complex environmental intelligence into an accessible tool for citizens, supporting a future-oriented vision of green mobility centered on soft and low-impact transport modes.
The project focuses on soft mobility—including walking, cycling, and micromobility—as a key lever to reduce emissions, improve urban livability, and promote healthier behaviors. Green Urban Navigator is being designed as a mobile application that helps users select routes optimized not only for distance or time, but also for environmental quality. Satellite-derived indicators such as surface temperature and atmospheric CO₂ concentration are integrated to guide more informed and conscious mobility choices.
A distinctive element of the project is the experimental integration of a Physiological Equivalent Temperature (PET) layer. PET is a widely recognized biometeorological index that combines thermal, radiative, and atmospheric variables to quantify human thermal comfort in outdoor environments. Embedding PET into routing logic allows mobility planning to account for how people actually experience heat stress in urban spaces, rather than relying on temperature alone.
Throughout 2026, Latitudo40 will progressively share results and insights as the project evolves. Green Urban Navigator represents a concrete step toward human-centered, climate-aware mobility planning powered by satellite intelligence.

.webp)


.webp)


